
The real cost of leaving your cash in the bank
Staying in cash feels like the safe option, the data tells a different story

There is a particular kind of comfort in leaving money in the bank. It feels responsible, prudent, even. The balance doesn't go down, no one is taking a risk with your savings, and when times feel uncertain — which they often do — cash feels like the sensible place to be.
But here is the uncomfortable truth, doing nothing is not a neutral act. It is a choice. And over time, it is a choice that quietly, consistently, and quite substantially erodes the real value of your money.
The short view looks reassuring
Over the last five years, from January 2021 to December 2025, the case for staying in cash looks, on the surface, almost defensible.
A cautious investment portfolio of 70% sterling corporate bonds and 30% global equities turned £100 into £115 over the period. The average deposit rate over the same period produced exactly the same, £115. The best available one-year fixed cash ISA, for a diligent saver who switched to the top rate at the start of each year, came out slightly ahead at £120.
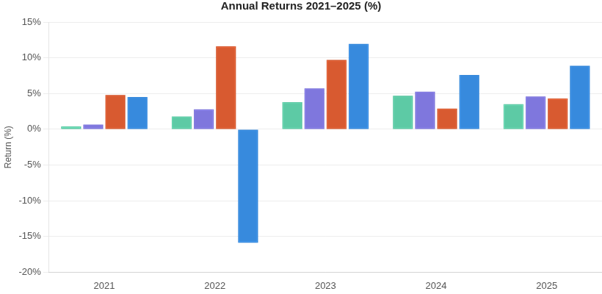
Annual Returns 2021–2025 (%) — Avg deposit rate, Best 1-yr ISA, RPI, 70/30 Portfolio
Source: Bond component: SPDR® Bloomberg Sterling Corporate Bond UCITS ETF (net). Equity: MSCI World Index GBP gross. Portfolio rebalanced annually.
The value of your investments can go down as well as up, so you could get back less than you invested. Past performance is not a reliable indicator of future performance.
On those numbers alone, you might reasonably ask: “What’s the point?” The portfolio and the average deposit account arrived at the same destination, and even the best ISA only pulled £5 ahead per £100 invested. Factor in that the 70/30 portfolio had a genuinely terrible 2022 with it falling around 16% as rising interest rates caused corporate bond prices to collapse, and the case for cash starts to seem even stronger.
But this is precisely where the short-term view misleads us.
The long view tells a very different story
Extend the horizon to ten years — from January 2015 to December 2025 — and the picture changes dramatically.
Average deposit rate: £122
Best 1-yr fixed ISA: £130
70/30 portfolio: £182
RPI cost of living: £159
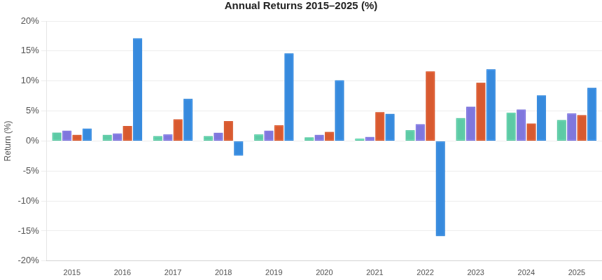
Annual Returns 2015–2025 (%) — Avg deposit rate, Best 1-yr ISA, RPI, 70/30 Portfolio
Source: Bond component: SPDR® Bloomberg Sterling Corporate Bond UCITS ETF (net). Equity: MSCI World Index GBP gross. Portfolio rebalanced annually.
The value of your investments can go down as well as up, so you could get back less than you invested. Past performance is not a reliable indicator of future performance.
The 70/30 portfolio turned £100 into £182. The best cash ISA produced £130, assuming a diligent saver who chased the top rate every single year without fail. The average deposit account — where most people’s money actually sits — produced just £122.
Meanwhile, the cost of living as measured by RPI rose so that what cost £100 in 2015 now costs £159. Every cash strategy fell well short of inflation over the decade. The portfolio was the only approach that not only kept pace with inflation but beat it, turning a real profit despite holding 70% in bonds.
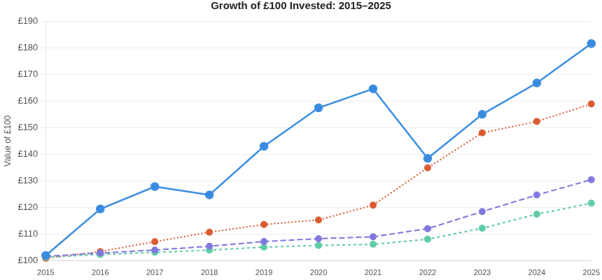
Growth of £100 Invested: 2015–2025 — cumulative value, annually rebalanced
Source: Bond component: SPDR® Bloomberg Sterling Corporate Bond UCITS ETF (net). Equity: MSCI World Index GBP gross.
The average deposit account lost £37 in real terms for every £100 saved over the decade. The portfolio gained £23 ahead of inflation
The illusion of safety
The reason cash feels safe is that the number on your bank statement doesn’t go down. If you put £10,000 in a savings account in January 2015, you will still see £10,000 (plus modest interest) a decade later. The figure is reassuring, but what is invisible (and this is what makes inflation so insidious) is that the £10,000 buys less. Considerably less.
Over the last decade, the UK experienced a prolonged period of near-zero interest rates that stretched from 2008 all the way through to 2022. During that time, the best cash ISA rates fell as low as 0.65% in 2021. The average deposit rate dropped to just 0.4% in the same year. Inflation, meanwhile, kept ticking along — and then surged to 11.6% in 2022, the highest in a generation.
Savers who kept their money in cash through that period did not avoid risk. They simply exchanged one type of risk, the short-term volatility of markets, for another that is far harder to see. The slow, steady, diminishment of purchasing power.
2022 was terrible for investments too
This is true, and it deserves an honest answer. As was mentioned above, the 70/30 portfolio fell around 16% in 2022, which was one of the worst years for bonds in modern history, while cash savers watched their balance hold steady. It was a painful year to be invested.
But, two things are worth noting:
First, that fall was temporary. By the end of 2023 the portfolio had recovered substantially and by 2025 it had reached £182 per £100 originally invested. Markets rewarded patience in a way that cash accounts simply could not.
Second, and more importantly, even including that crash, the ten-year outcome for the portfolio was £60 per £100 better than the average deposit account. The bad year happened. The recovery happened. The investor who stayed the course ended up far better off than the person who never invested at all.
Inaction is a decision
There is a cognitive bias at work here that behavioural economists call loss aversion: we feel losses more keenly than equivalent gains. Seeing a portfolio fall by 16% in a year feels like a concrete, painful loss. Watching the purchasing power of your savings quietly erode by 4% or more per year feels like nothing, because it is invisible.
This asymmetry is exactly why so many people stay in cash for far longer than serves their financial interests. The risk of investing feels real, the risk of not investing doesn’t feel like a risk at all — even when the evidence shows clearly that it is.
Choosing to keep money in the bank is not the absence of a financial decision. It is a decision — one that has cost the average saver dearly over the past decade
Over ten years, the average deposit account produced £122 from an initial £100. The cost of living demanded £159 for the same basket of goods. That £37 gap per £100 is not bad luck. It is the entirely predictable consequence of a strategy — or rather, the absence of one.
What this means in practice
None of this is an argument for taking unnecessary risk, or for putting money you might need next year into volatile markets. Cash has a legitimate role: as an emergency fund, a short-term holding, or the home for money with a specific near-term purpose.
But for money that has a horizon of five years or more — savings that are genuinely for more longer term purposes — the question is not whether to invest, but how to invest sensibly. A portfolio weighted heavily towards fixed income, like the 70/30 split examined here, is not a white-knuckle ride. It carries real volatility in bad years, as 2022 showed. But over a decade it has demonstrated a capacity to protect and grow purchasing power in a way that cash simply cannot replicate.
The real risk is not the one that shows up dramatically on a chart. It is the one that doesn’t: the quiet, compounding cost of doing nothing.

Daniel Stansall is a financial adviser based in London.
After completing a Masters in astrophysics Daniel embarked on a ten-year career trading interest rate derivatives. He decided to retrain as a financial adviser in 2014 and achieved chartered status in 2019. Daniel has excellent technical knowledge and enjoys helping clients to understand their goals and helping them achieve their financial objectives. Daniel is a keen cyclist and an Arsenal fan.
daniel@mwafinancial.co.uk | LinkedIn
Data & Methodology
The analysis covers January 2015 to December 2025. The bond component uses the State Street® SPDR® Bloomberg Sterling Corporate Bond UCITS ETF (UKCO/SYBS) net calendar year returns; 2015 uses the Bloomberg Sterling Corporate Bond Index.
The equity component uses the MSCI World Index GBP gross returns (MSCI official factsheet, December 2025). The portfolio is rebalanced annually on a 70/30 basis. Cash ISA rates reflect the best available one-year fixed rate at the start of each calendar year (Moneyfacts / Savings Champion). Average deposit rates from Bank of England data. RPI from the ONS; 2025 uses annual average 4.3%.
All growth figures assume £100 invested at the start of the period with returns compounded annually. The value of your investments can go down as well as up, so you could get back less than you invested. Past performance is not indicative of future results. This article is for informational purposes only and does not constitute financial advice.